[작성자:] mi601

  • How Should You Read Trading Volume?


    Why Volume Reveals What Price Can’t Tell You | Investment Principles Learned from Failure #003


    What You’ll Learn in This Article

    • Why price alone can be misleading
    • What trading volume actually tells investors
    • Three situations where volume matters most
    • How volume can help reduce emotional decisions

    Have You Ever Asked This Question?

    The stock is moving higher.

    But should you trust the rally?

    Many investors focus only on price.

    When the price rises, they assume demand is strong.

    When the price falls, they assume the trend is over.

    Unfortunately, the market isn’t that simple.

    Price tells you what happened.

    Volume often tells you why it happened.

    Learning to read both together can help you avoid many emotional mistakes.


    Why Trading Volume Matters

    Every trade requires both a buyer and a seller.

    Price shows the result.

    Volume shows how much participation supported that result.

    A strong rally with healthy volume often attracts broad market participation.

    A rally with weak or declining volume deserves more caution.

    Volume doesn’t predict the future.

    But it helps investors judge the strength behind a move.

    Three Situations Where Volume Matters Most

    ① Rising Price + Rising Volume

    This combination often suggests that buyers are actively participating.

    It doesn’t guarantee further gains,

    but it generally provides stronger confirmation than price alone.


    ② Rising Price + Falling Volume

    A rising price supported by shrinking volume may indicate weakening momentum.

    Fewer participants are willing to buy at higher prices.

    This doesn’t automatically mean the trend will reverse,

    but it deserves closer attention.


    ③ Sharp Increase in Volume Near Resistance

    Large volume near an important resistance area can signal that buyers and sellers are fighting for control.

    Sometimes price breaks through.

    Sometimes it fails.

    Volume helps investors recognize that the market is reaching an important decision point.


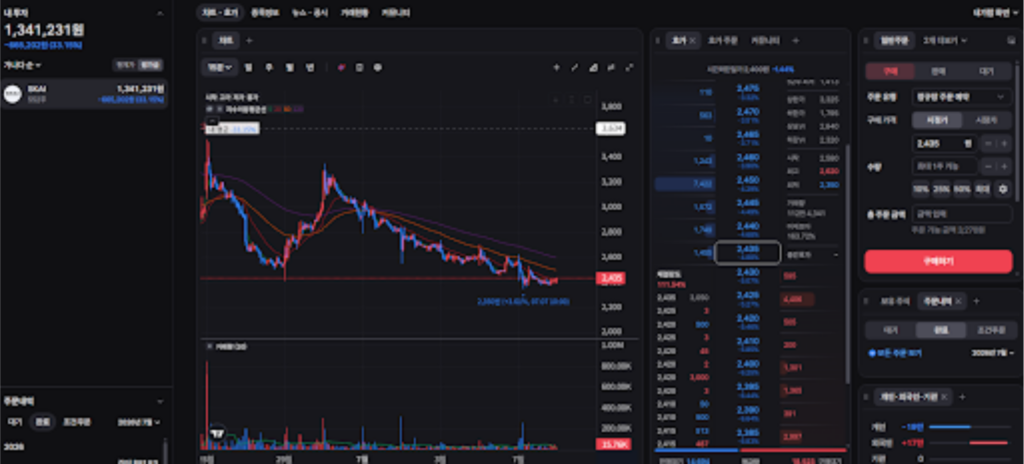
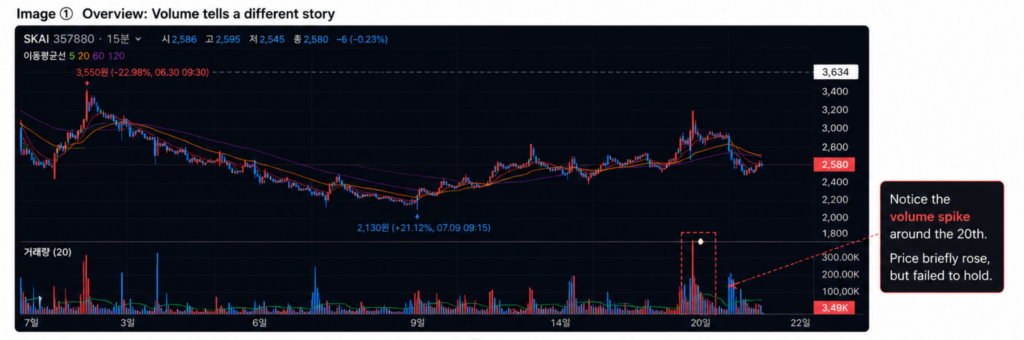
    Real Chart Example
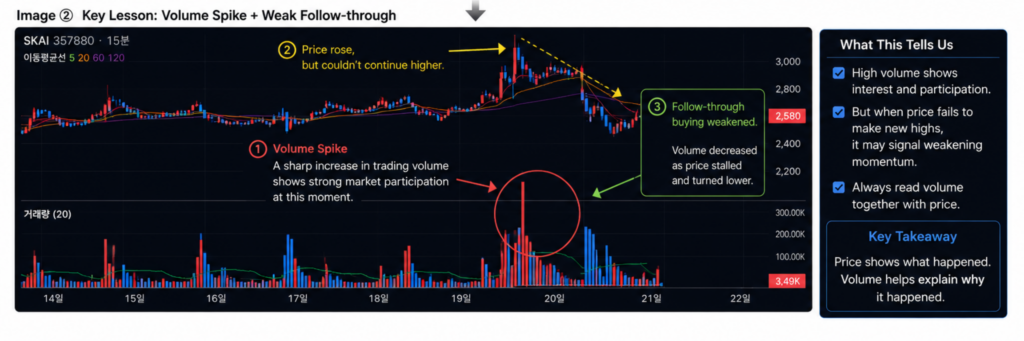
    Looking back at my own investment,

    I realized that I was watching only the price.

    The rebound looked encouraging.

    But volume was already suggesting that momentum was beginning to weaken.

    Had I combined price and volume together,

    I might have reduced risk much earlier.


    One Principle That Changed My Investing

    Price attracts attention.
    Volume confirms conviction.

    Today,

    I never evaluate price without looking at trading volume.

    Volume doesn’t eliminate uncertainty.

    But it helps me make decisions based on evidence rather than emotion.


    Quick Self-Check

    Before your next trade, ask yourself:

    □ Is volume supporting the price movement?

    □ Is today’s volume higher than recent averages?

    □ Am I buying because of evidence or excitement?

    □ Would I make the same decision if volume were ignored?


    Key Takeaways

    ✔ Price tells you what happened.

    ✔ Volume helps explain why it happened.

    ✔ Strong trends usually attract strong participation.

    ✔ Never analyze price without considering volume.


    Next Episode

    Investment Principles Learned from Failure #004

    Why Averaging Down Feels Right—But Often Goes Wrong

    We’ll explore why adding to a losing position can sometimes reduce risk—but can also become one of the most expensive psychological traps in investing.


    🇰🇷 한국어 요약

    이번 글에서는 거래량(Trading Volume)이 가격보다 먼저 시장의 힘을 보여줄 수 있다는 점을 살펴보았습니다.

    많은 투자자는 가격만 보고 판단하지만, 가격은 결과를 보여줄 뿐입니다. 거래량은 그 움직임에 얼마나 많은 시장 참여자가 동의하고 있는지를 보여주는 중요한 단서입니다.

    특히 다음 세 가지 상황은 반드시 함께 확인해야 합니다.

    • 가격 상승 + 거래량 증가
    • 가격 상승 + 거래량 감소
    • 저항 구간에서 거래량 급증

    이번 경험을 통해 제가 얻은 원칙은 하나입니다.

    가격은 결과를 보여주고, 거래량은 그 결과의 신뢰도를 판단하는 중요한 단서를 제공합니다.

    감정보다 근거를 바탕으로 투자하기 위해서는 항상 가격과 거래량을 함께 분석해야 합니다.


    Disclaimer

    This article is based on my personal investing experience and is intended for educational purposes only. It should not be considered financial or investment advice. Always conduct your own research before making investment decisions.
  • Why Investors Struggle to Cut Losses: The Hidden Psychology of Break-even Bias


    Investment Principles Learned from Failure #002

    What You’ll Learn in This Article
    Why cutting losses feels almost impossible for the human brain

    The psychological trap behind the Break-even Bias

    Why hope can become a dangerous emotion in investing

    How experienced investors separate emotions from decisions

    Have You Ever Been Unable to Press the Sell Button?
    Imagine your investment is down more than 20%. Days turn into weeks. Then the stock finally begins to rebound. Instead of asking, “What is the market telling me?” many investors ask, “How much longer until I get my money back?”

    That single question changes everything. At that moment, you stop managing risk and start protecting your emotional attachment to the position. Most investors don’t stay trapped because they picked a bad company. They stay trapped because they become anchored to their entry price.

    Why This Happens
    Behavioral finance has studied this phenomenon for decades. Two psychological biases usually work together.

    Loss Aversion
    Human beings naturally feel the pain of losing much more strongly than the pleasure of gaining. Accepting a loss feels like admitting failure. As a result, many investors delay selling even when the evidence says they should.

    Break-even Bias
    Once an investment falls, our average purchase price becomes an emotional anchor. Instead of asking, “Would I buy this stock today?” we ask, “Can I just get back to break even?” The problem is simple: The market doesn’t know your entry price.

    Real Portfolio Example


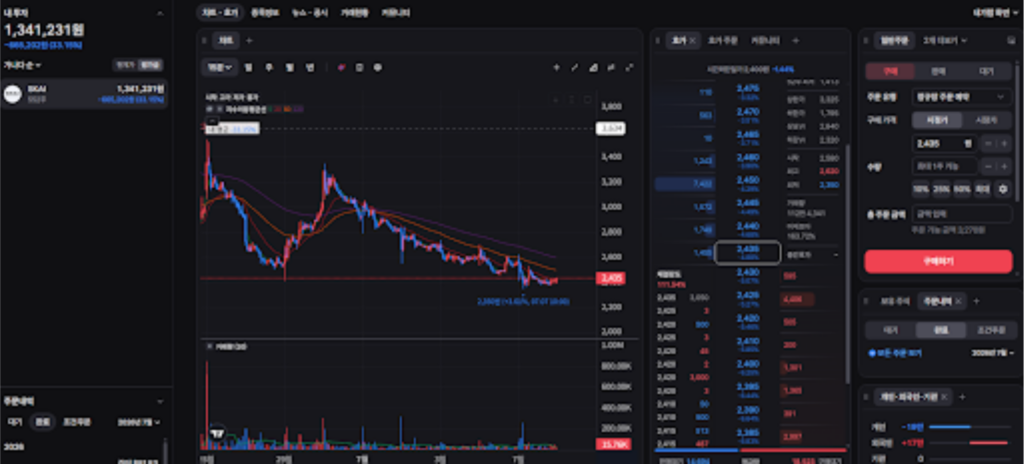
    Average Cost: 3,634 KRW

    Shares Held: 552

    Rebound High: 2,770 KRW

    Loss at the Time: More than 20%

    Looking back, I realized something important.

    I wasn’t following the market objectively.

    I wasn’t measuring risk properly.

    I was simply waiting for my purchase price to return.

    My average purchase price became more important than the market itself.

    Three Technical Signals I Ignored


    After reviewing the chart objectively, three warning signs became obvious.

    Rising Volume with Weak Momentum: Trading volume increased, but price struggled to continue higher. This suggested that upward momentum was weakening despite increased market participation.

    Major Resistance Zone: The rebound reached a price area where previous investors were likely waiting to sell. Resistance doesn’t guarantee a reversal, but it increases risk.

    No Clear Trend Reversal: The rebound looked encouraging, but there wasn’t enough evidence to conclude that the long-term downtrend had ended. Hope replaced objective analysis.

    The Lesson I Learned
    A losing position is not a problem by itself. The real problem is holding a position without a clear reason. A disciplined investor does not ask, “When will I recover my money?” They ask, “Is this still the best place for my capital today?”

    The market rewards discipline, not emotional attachment.

    Many investors may look at the later price movement and say, “See? Waiting worked.” But investing doesn’t work that way. The stock eventually moved higher. That doesn’t mean ignoring risk was the right decision. Good investment decisions should be judged by the quality of the process—not simply by the final outcome. Because in investing, good decisions sometimes produce bad outcomes, and bad decisions sometimes produce good outcomes. Long-term success depends on consistently following sound principles, not on getting lucky once.

    One Question That Changed My Investing
    Whenever I hesitate, I now ask myself one question: “If I had no position today, would I buy this stock at the current price?” If the answer is No, why am I still holding it? That question removes emotion and forces me to evaluate the investment objectively.

    Quick Self-Check
    Before your next trade, ask yourself:

    □ Am I protecting my capital?

    □ Or am I protecting my ego?

    □ Would I buy this stock today?

    □ Is my decision based on evidence or hope?

    Key Takeaways
    ✔ Your average purchase price has no influence on future market movements.

    ✔ Hope is not an investment strategy.

    ✔ Position sizing and disciplined exits reduce emotional decision-making.

    ✔ Great investors don’t avoid losses. They avoid catastrophic losses.

    Next Episode
    Investment Principles Learned from Failure #003
    How Should You Read Trading Volume?
    Most investors only watch price. Professional investors pay close attention to volume because it can reveal changes in market participation and momentum. Price tells you what happened; volume often tells you why it happened.

    🇰🇷 한국어 요약
    이번 글에서는 투자자들이 손실을 확정하지 못하는 이유인 손실 회피 성향(Loss Aversion)과 본전 심리(Break-even Bias)를 살펴보았습니다. 저는 평단가 3,634원, 보유수량 552주인 종목이 약 2,770원까지 반등했을 당시, 리스크 관리를 다시 검토했어야 했지만 시장보다 평단가에 집착한 나머지 아무런 행동도 하지 못했습니다.

    시간이 지나 주가가 더 상승했다고 해서 당시의 판단이 옳았던 것은 아닙니다. 투자는 결과가 아니라 당시의 정보와 원칙을 기준으로 평가해야 합니다. 이번 경험을 통해 제가 얻은 가장 중요한 원칙은 다음과 같습니다.

    시장은 나의 매수가를 모릅니다.

    하지만 내 감정은 그 숫자에 계속 집착합니다.

    좋은 투자는 최고점에서 매도하는 능력이 아니라, 감정을 통제하고 리스크를 관리하며 시장에서 오래 살아남는 과정입니다.

    Disclaimer

    This article is based on my personal investing experience and is intended for educational purposes only. It should not be considered financial or investment advice. Always conduct your own research before making investment decisions.
  • When Should You Reduce Your Stock Position?

    Lessons from a Real Investment Loss About Risk Management | Investment Principles Learned from Failure #001

    Every investor eventually faces the same difficult question:

    Should I keep holding, or should I reduce my position?

    What You’ll Learn in This Article

    • Why position sizing matters more than finding the perfect selling price
    • Three technical signals that suggested it was time to reduce risk
    • How a simple partial exit could have changed the outcome
    • Why protecting your capital is more important than protecting your ego

    Would You Sell… or Wait?

    Imagine your investment is down more than 20%.

    Then the stock finally rebounds.

    Would you sell part of your position?

    Or would you wait until you break even?

    I chose the second option.

    I kept telling myself,

    “Just a little higher… then I’ll sell.”

    That decision became one of the most valuable investing lessons I’ve ever learned.

    Most investors don’t lose money because they can’t pick good stocks.

    They lose because they don’t know when to reduce risk.

    This article analyzes my own trading experience and explains why position sizing may be one of the most underrated skills in investing.

    Why Most Investors Fail at Position Sizing

    Position sizing isn’t about selling everything.

    Nor is it about holding forever.

    It’s about adjusting your exposure as market conditions change.

    Unfortunately, many investors become trapped by one dangerous emotion:

    The Break-even Bias.

    Instead of analyzing the market,

    we begin negotiating with our emotions.

    “I’ll sell once I get my money back.”

    The market doesn’t know your entry price.

    It only reacts to buyers and sellers.

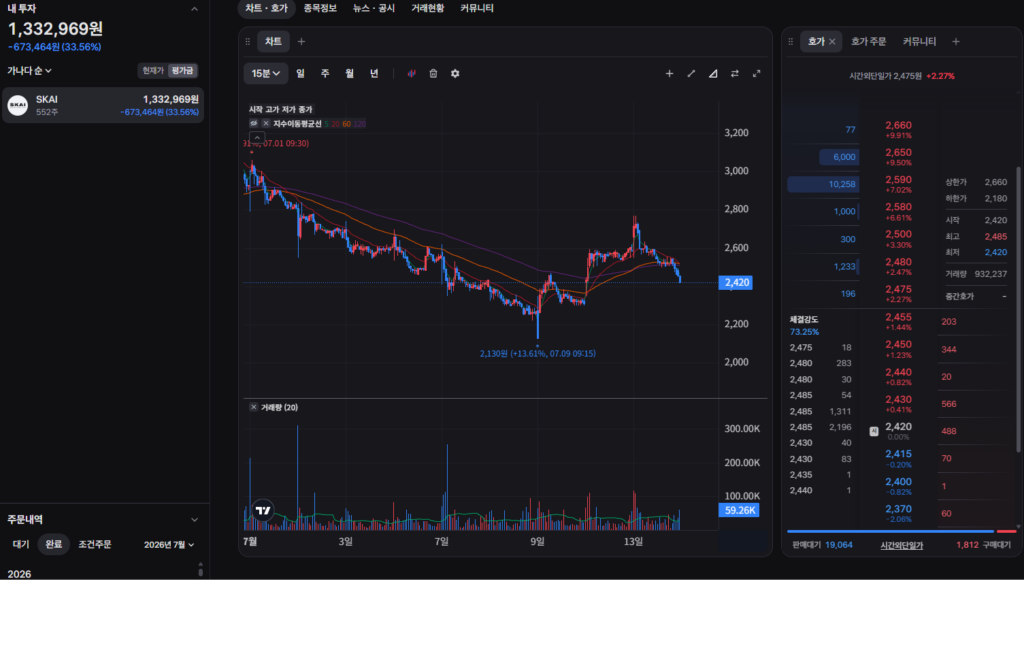
    Real Portfolio Example

    (Insert portfolio screenshot here 실제 계좌 이미지 삽입 ])

    Average Cost: 3,634 KRW

    Shares Held: 552

    Highest Rebound Price: Approximately 2,770 KRW

    Looking back,

    I wasn’t following the chart.

    I wasn’t watching momentum.

    I wasn’t measuring risk.

    I was simply staring at my average purchase price.

    That emotional attachment prevented me from making a rational decision.

    Three Technical Signals I Ignored

    Let’s compare the difference one small decision could have made.

    Real investment portfolio and stock chart showing position sizing analysis

    After reviewing the chart objectively, three signals stood out.

    1. Rising Volume with Weak Price Momentum

    Trading volume increased,

    but price failed to continue making strong advances.

    This suggested that selling pressure might have been increasing.

    1. Price Was Approaching a Major Resistance Zone

    The rebound reached an area where previous investors were likely waiting to sell.

    Resistance zones often become natural places for profit-taking or risk reduction.

    1. No Clear Evidence of a Trend Reversal

    A rebound is not the same as a new uptrend.

    At that time,

    there wasn’t enough evidence to conclude that the long-term trend had changed.

    I allowed hope to replace objective analysis.

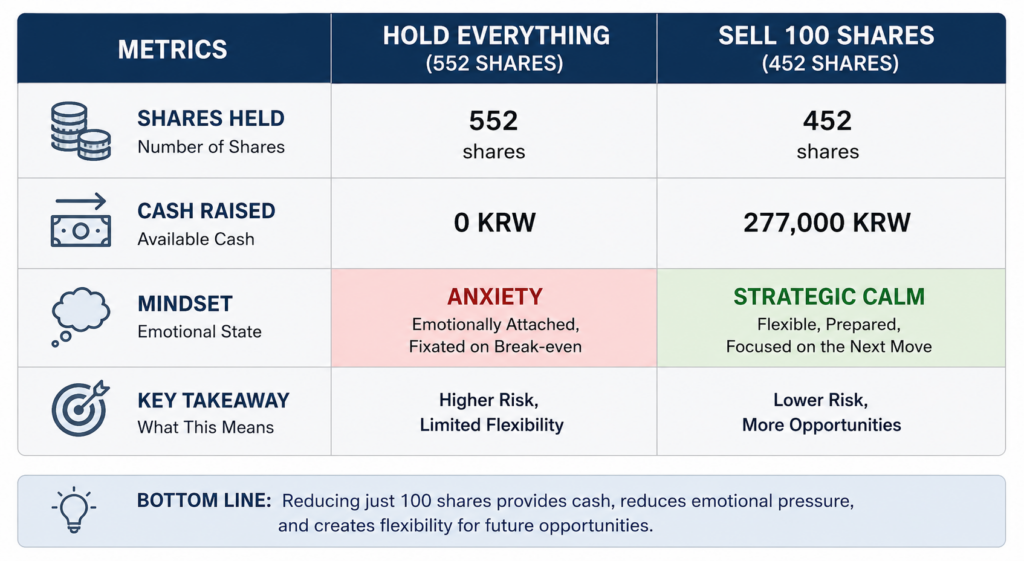
    Position sizing comparison between holding all shares and selling 100 shares

    Notice something important.

    This isn’t about selling everything.

    It’s about creating options.

    By reducing only part of the position,

    I could have lowered emotional pressure,

    secured cash,

    and prepared for future opportunities.

    Position sizing doesn’t guarantee higher profits.

    It gives you more flexibility to protect your capital and seize future opportunities.

    The Lesson That Changed My Investing

    Today, I follow one simple investment principle.

    A good exit isn’t about selling at the highest price.

    It’s about reducing unnecessary risk.

    Selling part of a position isn’t admitting defeat.

    It’s giving yourself another chance to make better decisions later.

    Key Takeaways

    • Your average purchase price should never control your decisions.
    • Position sizing helps reduce emotional trading.
    • Partial selling creates flexibility for future opportunities.
    • Capital preservation always comes before profit maximization.

    Quick Self-Check

    1. Before making your next investment decision, ask yourself:
    2. Am I following the market or my emotions?
    3. Is this rebound supported by volume?
    4. Am I approaching a resistance level?
    5. Do I already have a position-sizing plan?

    Next Episode

    Investment Principles Learned from Failure #002

    Why Investors Can’t Cut Their Losses

    We’ll explore why the desire to “break even” often keeps investors trapped in losing positions far longer than they should.

    Question for Readers

    Have you ever held onto a losing position simply because you wanted to get your money back?

    Did waiting help…

    or make things worse?

    Share your experience in the comments.

    Investment Principles Learned from Failure

    001 Position Sizing

    Remember

    • ✔ Don’t chase the perfect exit.
    • ✔ Reduce risk before the market forces you to.
    • ✔ Position sizing isn’t weakness. It’s one of the strongest forms of risk management.

    It’s one of the strongest forms of risk management.

    🇰🇷 한국어 요약

    이번 글에서는 실제 투자 경험을 바탕으로 비중조절(Position Sizing) 의 중요성을 살펴보았습니다.

    저는 평단가 3,634원, 552주를 보유한 상태에서 약 2,770원까지 반등했지만, “조금만 더 오르면 팔겠다”는 본전 심리 때문에 비중을 줄이지 못했습니다.

    차트를 다시 분석해 보니,

    • 거래량 증가에도 상승 탄력이 둔화되었고,
    • 이전 매물대 저항에 접근했으며,
    • 추세 전환을 확신할 근거는 부족했습니다.

    만약 100주만이라도 매도했다면, 현금을 확보하고 다음 기회를 준비할 수 있었을 것입니다.

    이번 경험을 통해 제가 얻은 가장 중요한 원칙은 다음과 같습니다.

    좋은 매도는 최고가를 맞히는 것이 아니라, 리스크를 줄이는 것입니다.

    Disclaimer

    This article is based on my personal investing experience and is intended for educational purposes only.

    It should not be considered financial or investment advice.

    Always conduct your own research and consider your financial situation before making investment decisions.
      Thank you for reading.

      See you in Investment Principles Learned from Failure #002.

    • Retail Investor Log: How I Failed a -36% Drawdown and My New Rule-Based Strategy

      Caption: My current portfolio status. A harsh reality, but an essential record for growth.

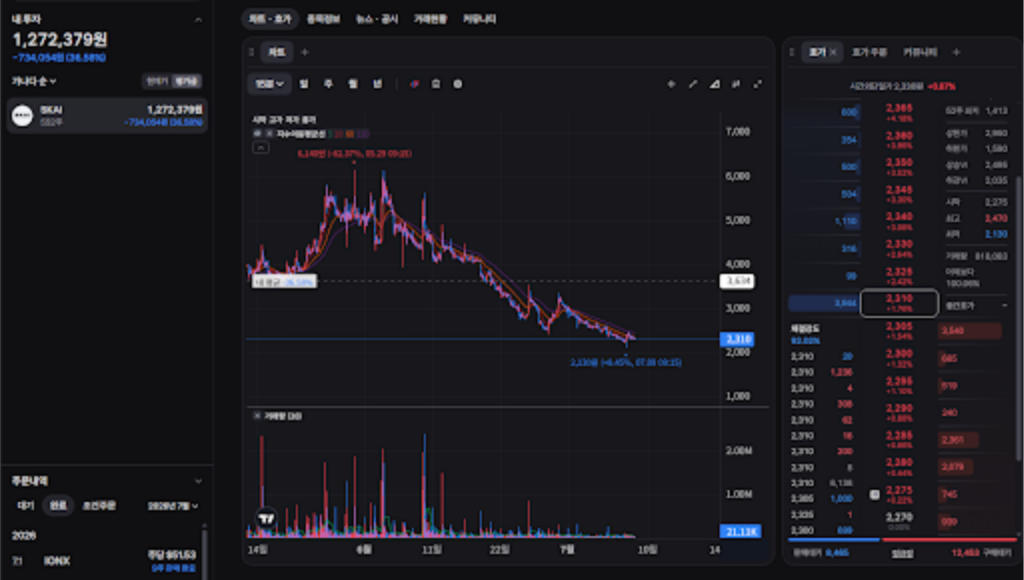
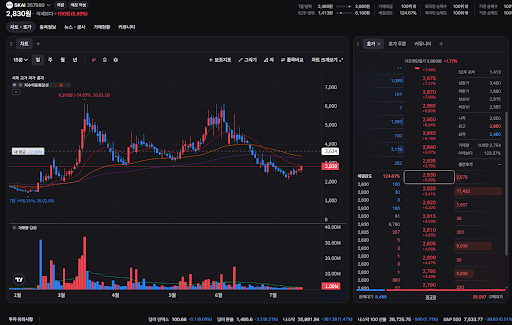
      Starting my investment journey, I learned the hardest lesson of all: Hope is not a strategy. Currently, my portfolio shows a -36.58% loss on SKAI, and I am documenting this raw experience to hold myself accountable and share the technical insights I’ve gathered.

      1. Technical Analysis: The 15-Minute Chart Warning
        My trading decisions are based on the 15-minute timeframe.

        Caption: Analysis of the 15-minute chart shows a clear, persistent downward trend.

      Looking back at the chart, the moving averages (5, 20, 60, and 120) showed a clear bearish signal.

      Actionable Tip: When the price consistently stays below the 20-period moving average with low trading volume, it is a definitive sign to exit. I ignored this, waiting for a rebound that never came.

      1. The Psychology and Order Book Analysis

        Caption: Order book analysis showing significant selling pressure.

      The order book consistently showed heavy selling pressure blocking any rebound attempts. My biggest mistake was “hope bias”—believing the stock would rise tomorrow despite the technical data.

      1. My New Rule-Based Strategy
        To prevent this, I am adopting a stricter system:

      The 10% Rule: If any position drops more than 10%, I will automatically cut the loss.

      Data-Driven Entry: I will only enter trades when the 15-minute chart shows a clear breakout above the 60-period moving average.

      As I start a new chapter with US equities, I am transforming this pain into a repeatable, rule-based investment system.

      [한글 요약: 200만 원으로 시작한 개인 투자자의 매매 일지]
      핵심 요약:
      200만 원으로 시작한 주식 투자에서 SKAI 종목으로 -36%의 큰 손실을 보았습니다. 단순히 손실을 기록하는 것을 넘어, 왜 실패했는지 기술적으로 분석하고 이를 해결하기 위한 ‘매매 원칙’을 세웠습니다.

      실패 원인: 15분 차트상 명확한 하락 추세(이동평균선 하향)가 있었음에도 “내일은 오르겠지”라는 희망으로 손절 타이밍을 놓쳤습니다.

      정보성 팁(15분 차트 매매): 15분 봉 기준으로 20일 이동평균선 아래에서 거래량이 터지지 않는다면, 이는 무조건적인 매도 신호입니다.

      새로운 투자 원칙: 10% 손실 시 기계적 손절(자동 매도), 감정이 아닌 데이터(60일 이동평균선 돌파)에 기반한 매수.

      결론:
      이번 -36%의 경험은 수업료라고 생각합니다. 앞으로는 미국 주식 매매 시 감정을 배제하고, 제가 세운 원칙을 철저히 지키는 ‘데이터 기반 투자자’로 성장하겠습니다.

    • Title: Week 1 of My Trading Exile: Why I’m Turning Away from the Charts

      Today, the market proved once again that it doesn’t care about my plans. The rebound I was hoping for in SKAI failed to materialize.

      My 11 Iron Rules clearly state that I should cut losses mechanically and move on to the next opportunity. It’s the “right” answer. But honestly? My hands won’t move. The weight of the loss feels too heavy to simply click ‘sell’ and accept the reality.

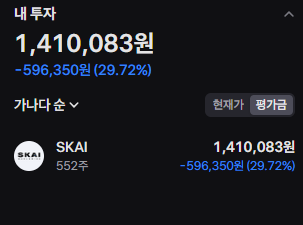
      The heaviest chart I’ve ever had to look at. A 29.72% loss that is currently paralyzing my trading discipline.(내가 봐야 했던 가장 무거운 차트. 현재 나의 트레이딩 원칙을 마비시키고 있는 29.72%의 손실.)

      Instead of forcing a trade out of anxiety, I’ve made a decision: I am hiding the charts for this entire week.

      If I can’t trust my own discipline in the heat of the moment, I shouldn’t be looking at the numbers at all. This isn’t giving up; it’s a defensive measure to keep myself from making irrational, impulsive decisions. I’ll be back when my mind is clear, but for now, I’m going into exile.

      Sometimes, the best trade is the one you don’t make.

      [한국어 요약]

      오늘 SKAI 종목의 반등이 끝내 실패했습니다. 원칙대로라면 기계적으로 손절하고 갈아타야 한다는 것을 머리로는 잘 알지만, 마음이 따라주지 않아 손이 나가지 않습니다. 감정에 휩쓸려 충동적인 매매를 하지 않기 위해, 이번 주 일주일 동안은 아예 차트를 보지 않기로 결정했습니다. 지금은 억지로 대응하기보다, 시장에서 한 발 물러나 마음을 다잡는 것이 저의 유일한 생존 전략입니다.

    • My Survival Strategy for SKAI: How I’m Handling a 28% Loss with My New Trading Rules

      Introduction I am currently facing a 28% loss on my investment in SKAI. I admit, I entered this trade based on a “hunch” rather than data, and the market has been unforgiving. However, instead of panic selling, I have decided to observe the market and wait for the right moment to minimize my losses. This is not a story of failure, but a record of my journey to survival as a middle-aged trader.

      Why I’m Choosing to Observe (My Strategy) Many might ask, “Why not just cut your losses now?” Based on my analysis, SKAI is not a fundamentally broken stock. My plan for Monday is to:

      • Monitor the price action closely against key technical support levels.
      • Wait for a confirmed reversal signal rather than impulsive action.
      • Maintain my discipline and avoid adding more weight until the trend shows stability.

      My 11 Iron Rules for Survival To avoid repeating these mistakes, I have established a strict set of “Iron Rules” that I will follow moving forward:

      1. Define the Mode: Choose between day trading or swing trading before entry—never change mid-trade.
      2. Market Priority: Scale back if the market is weak; operate aggressively only when the market is strong.
      3. Entry Strategy: Only enter near support levels (moving averages or previous highs) and never chase breakouts.
      4. Risk Management: Limit each position to 30-40% of my account.
      5. Strict Discipline: Stop-loss and take-profit levels must be set before every entry.

      Closing Thoughts Trading is not about getting rich overnight; it is about survival and consistency. By following these rules and documenting my reality, I hope to turn this crisis into a turning point. If you are a trader fighting to find your footing, I hope my raw, unfiltered survival guide resonates with you.

      [Korean Summary / 한국어 요약]

      현재 저는 SKAI 종목에서 28%의 손실을 보고 있습니다. 데이터가 아닌 ‘감’에 의존한 매매가 가져온 뼈아픈 결과입니다. 하지만 무작정 손절하기보다, 기업의 본질을 분석하며 기술적 지표를 통해 손실을 최소화할 수 있는 반등 지점을 기다리기로 했습니다. 이 기록은 실패담이 아니라, 생존을 위해 매일 치열하게 고민하고 원칙을 세워가는 중년 트레이더의 생존기입니다. 위기를 기회로 바꾸기 위해 제가 세운 ‘철혈 투자 원칙 11가지’를 함께 공유합니다.

    • From 28% Loss to Survival: My Brutal Reality as a Middle-Aged Trader

      (28% 손실, 벼랑 끝에서 시작하는 중년의 생존 일지)

      I’m in my middle age, and the job market has closed its doors to me. My health isn’t what it used to be, so labor-intensive work is no longer an option. With no retirement savings to fall back on, I turned to the stock market—not because I wanted to get rich overnight, but because I needed to survive.

      I started with 2 million won, hoping to make enough to get by. I thought if I just bought the leading stocks, I would be safe. I was wrong. The reality of the market is cold and unforgiving.

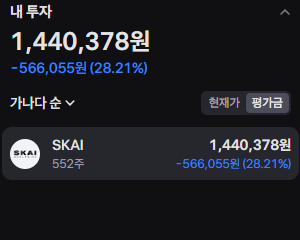
      A 28% loss. 560,000 won of my hard-earned savings is gone. It feels surreal and devastating. I’m not posting this to brag about profits—I have none to show. I’m posting this because I have nowhere else to turn.

      I’m starting this blog to document my journey from the bottom. I don’t know if I’ll succeed or if I’ll lose everything. But I refuse to hide my reality anymore. I will record every move I make, every mistake I commit, and every ounce of effort I put into surviving this market.

      I’m not a guru. I’m just a middle-aged man fighting for a way to live. If you’re also struggling to find your footing, perhaps my raw, unfiltered survival guide will resonate with you.

      I’m not doing this for luxury. I’m doing this to eat. Let the record show where I stand today.

      [한글 요약] 몸이 좋지 않아 육체노동은 어렵고, 나이 때문에 취업도 막막합니다. 노후 대책도 없는 막막한 현실에서, 저는 먹고살기 위해 주식 시장에 뛰어들었습니다.

      200만 원으로 시작했지만 현실은 냉혹했습니다. 지금 계좌는 28% 손실 중입니다. 56만 원의 소중한 자산이 사라졌습니다. 화려한 성공담을 쓰려는 것이 아닙니다. 벼랑 끝에서 살아남기 위해 발버둥 치는 나의 치열한 기록을 남기려 합니다.

      내가 성공할지, 아니면 가진 것을 다 잃을지 모릅니다. 하지만 이제 현실을 숨기지 않겠습니다. 나처럼 갈 곳 없는 중년이, 이 시장에서 어떻게든 살아남으려 몸부림치는 ‘날것의 현실’을 기록하겠습니다. 나는 부자가 되려는 게 아닙니다. 그저 먹고살기 위해 이 기록을 시작합니다.

      TradingDiary #SurvivalMode #StockMarket #MiddleAge #LifeJournal

    • Top 5 TradingView Indicators for High-Profit Crypto Trading in 2026

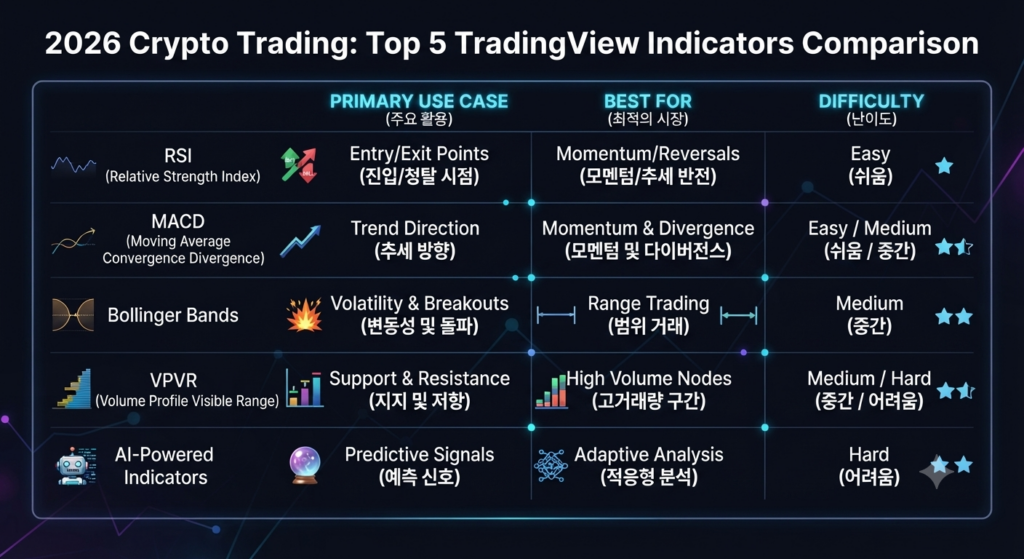
      If you want to maximize your trading profits in 2026, using the right technical analysis tools is essential. TradingView has become the ultimate platform for both beginner and professional traders worldwide.

      To help you get ahead in the market, here are the top 5 TradingView indicators you should be using right now for high-profit crypto and forex trading.

      1. Relative Strength Index (RSI) with Divergence

      The standard RSI is great, but looking for RSI divergences is where the real profit lies. It helps you spot potential market reversals before they happen, giving you the perfect entry and exit points.

      2. Moving Average Convergence Divergence (MACD)

      MACD is a classic momentum indicator. By watching the crossover of the MACD line and the signal line, you can easily identify the strength of a trend and ride the wave for maximum gains.

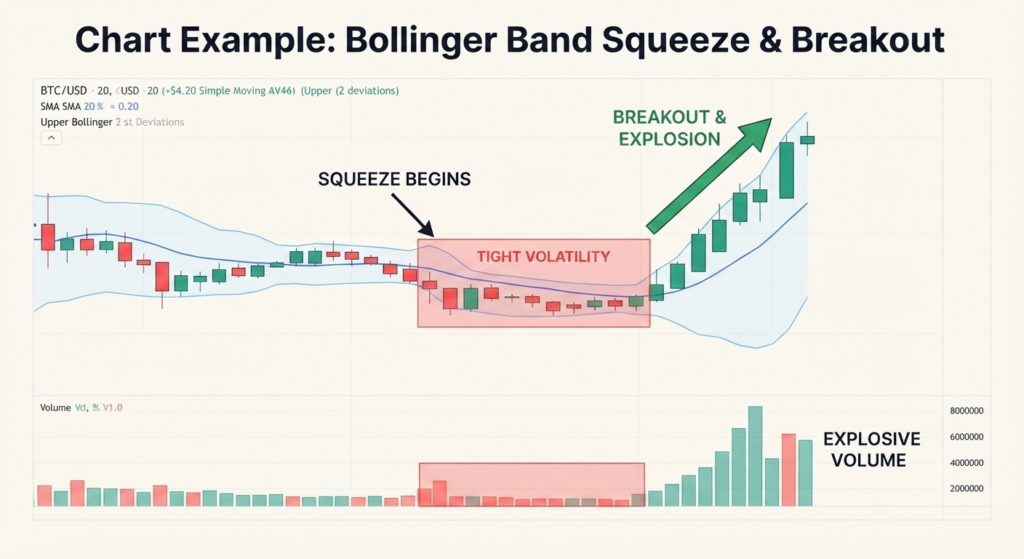
      3. Bollinger Bands for Volatility Trading

      Bollinger Bands contract during low volatility and expand during high volatility. Trading the “Bollinger Band Squeeze” is one of the most reliable strategies for catching explosive market breakouts.

      4. Volume Profile Visible Range (VPVR)

      Unlike standard volume bars, VPVR shows trading activity at specific price levels. This allows you to see exactly where big institutional buyers and sellers are hiding their orders.

      5. Custom AI-Powered Trend Indicators

      In 2026, AI-integrated scripts on TradingView are changing the game. Combining AI signals with traditional indicators reduces false breakouts and significantly increases your win rate.


      Disclaimer: Trading involves risk. Always combine these indicators with proper risk management and a solid trading strategy.

      [Korean Summary / 한국어 요약] 2026년 암호화폐와 주식 시장에서 수익을 극대화하고 싶으신가요? 위에서 소개한 트레이딩뷰(TradingView) 지표 5가지를 활용하면 차트 분석의 정확도를 획기적으로 높일 수 있습니다. 기술적 분석을 통해 더 현명한 투자 결정을 내리고 싶은 분들은 위 영어 본문의 내용을 확인해 보세요.

    • Hello world!

      Welcome to WordPress. This is your first post. Edit or delete it, then start writing!